Since the birth of pay per click (PPC) advertising digital marketers everywhere have tried just about everything to improve campaign conversion rates. In this article we dive into industry benchmarks and how to improve them.
There are some generic benchmarks that exist in the digital world today and the big one is an average conversion rate of 3%. Basically if I get 100 clicks on my ads, 3 of them convert. We all know conversions are important, after all.. conversions pay the bills around here.
The good ole 3% benchmark is how PPC Experts around the world are able to estimate a campaigns cost per lead, total conversions and most importantly.. return on your investment. Yes this 3% benchmark has become popular over the years.. but it's 2018 now and time we keep our brains full of only the freshest data the internet has to offer. Let's have a look at the latest Google Adwords industry benchmarks from the team at Wordstream.
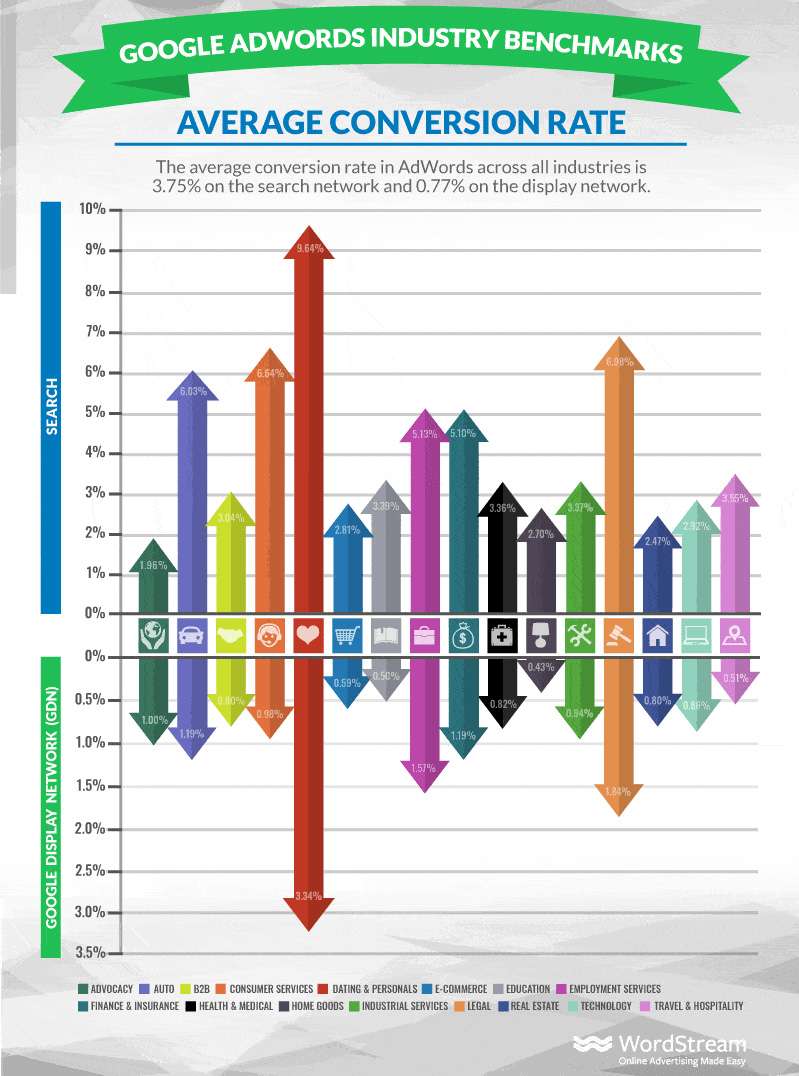
Looking at the above data, you might be feeling some serious FOMO OR you could feel a hell of a lot more confident in your current campaigns. (Good on ya if you're the latter) If you're feeling the FOMO then get in touch to see if we can help get you up to scratch.
Now, we all need to remember that every website is VERY different. There are millions of websites today all with different designs, goals, target markets, industries, buying cycles, and more. This means that what Amazon.com calls a conversion vs what Youtube.com calls one are two VERY different things. While Amazon obviously wants users purchasing products, Youtube wants people devouring content and engaging with the platform.
What a website defines as a "conversion" can be anything from filling out a contact form, purchasing a product or downloading a coupon. The list goes on and can be different for every website.
So why are only 3 out of 100 clicks converting?
We will break down a few reasons you are only executing a 3% (or less) conversion rate along with some examples and actionable steps to improve your campaigns.
Your Landing Page Sucks
Nobody wants to hear that their baby is ugly, but sometimes we need to come to terms with the fact that your website might not be ''conversion friendly'' enough to bring in serious results.
Below we have a website that hosts great example of how NOT to design a landing page.
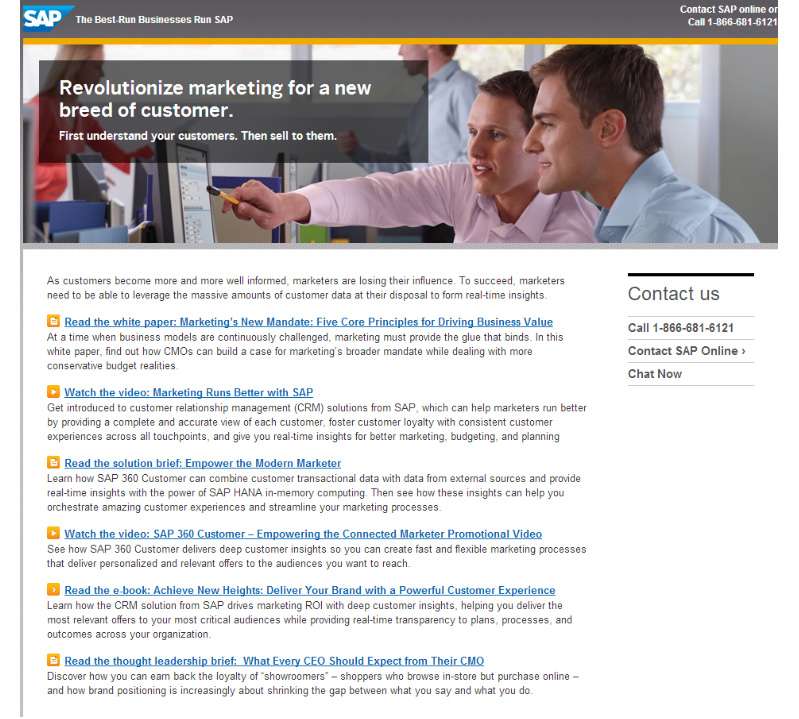
The above landing page is far from ideal for a variety of reasons:
- Main Call to action (çontact us) is no-where near LOUD enough
- No contact form above the fold
- There are way too many outbound links for the user to get distracted and leave
- Mixed messaging throughout the content that serves different goals
Here is a landing page that follows best practices:
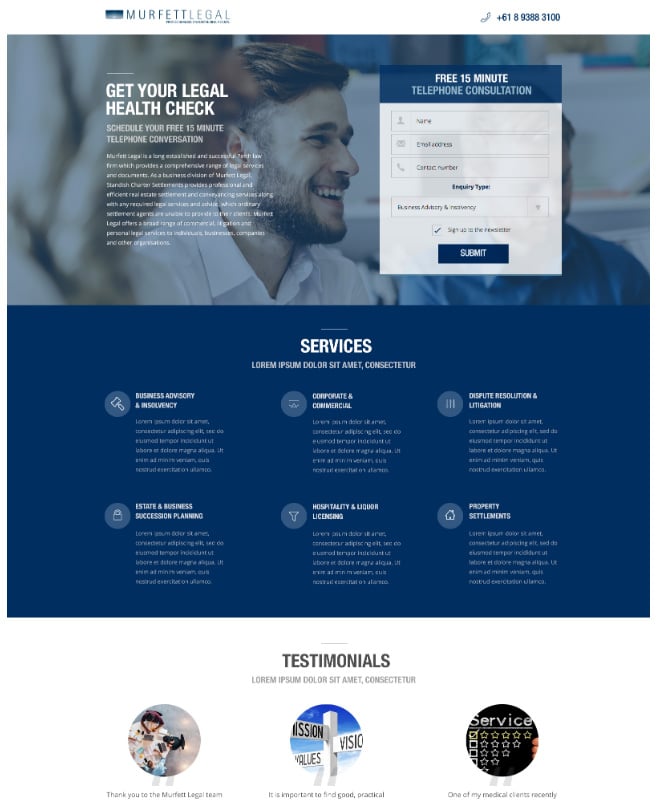
As you can see the above landing page:
- Holds 1 very clear call to action
- Provides immediate value to the user
- Showcases relevant services
- Displays testimonials which build trust
Check out the ACTUAL RESULTS from the above 'Legal Health Check' landing page:
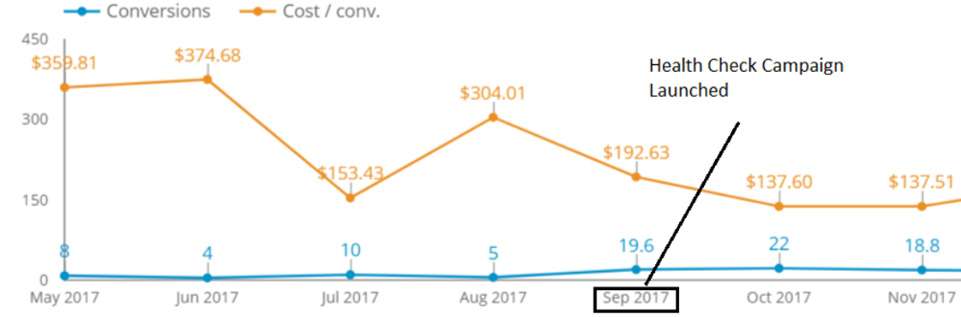
You are looking at 7 months worth of conversion data that shows the before & after effect of launching the new landing page. Our client saw a:
- 140% avg decrease in cost per lead
- 65% avg increase in monthly conversions
I hope we have shown the importance of creating a landing page that follows best practices, especially when running Pay Per Click advertising.
Your targeting is broad
Whether it be keywords, interests, behaviors or demographics something isn't working and you are not getting the most out of your clicks. To make sure you are not being too generic with how your ads are targeted, lets look at a few common cases.
Broad match keywords (SEM)
At ALYKA we like to think of broad match keywords as Google's largest source of revenue. Unless managed properly, broad match generally leads to a lot of wasted dollars. Lets go through how this match type makes Google billions of dollars per year and how it can give less experienced advertisers a false representation of campaign performance.
The Keyword You Chose vs Actual search term the user typed into Google:
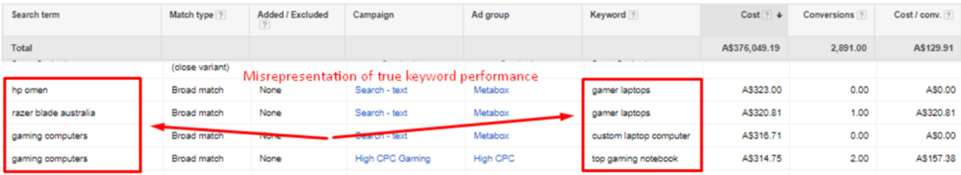
See how the 'search terms' column and the broad match keywords selected are completely different. This is why you should be using different match types for your keywords.
Here is a visual breakdown of the different keyword match types
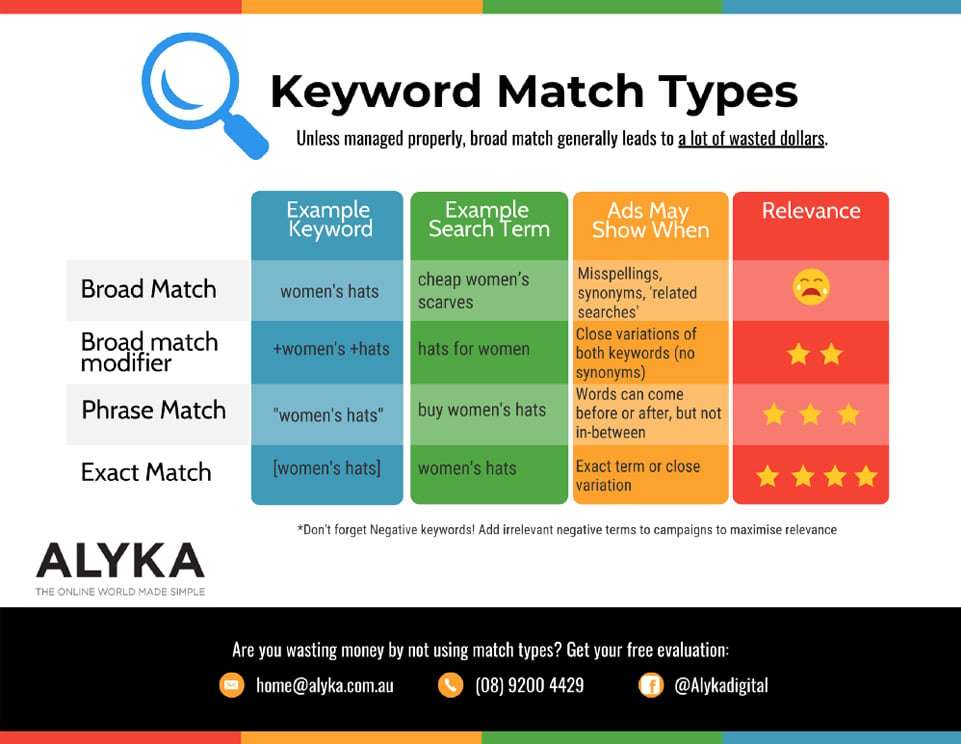
Match types give you more control over what you are actually spending money on. This is one of the most common issues we see with new client Adwords accounts and its usually a quick win when they start working with us.
Your Ads aren't relevant
Nobody likes boring irrelevant ads, especially online. Its important to think about which audience will be seeing which ad you are serving. Nowadays you have a whole lot of options when it comes to segmenting your audiences to show them highly relevant ads they will actually respond with.
Segment users that have already purchased a product or filled out a contact form. Then you can start treating these users differently than people who haven't previously converted.
You're not 'profiling' your traffic
Begin building profiles for your website traffic with segmented lists. Break up your website visitors into buckets based on a variety of identifier factors in Google Analytics:
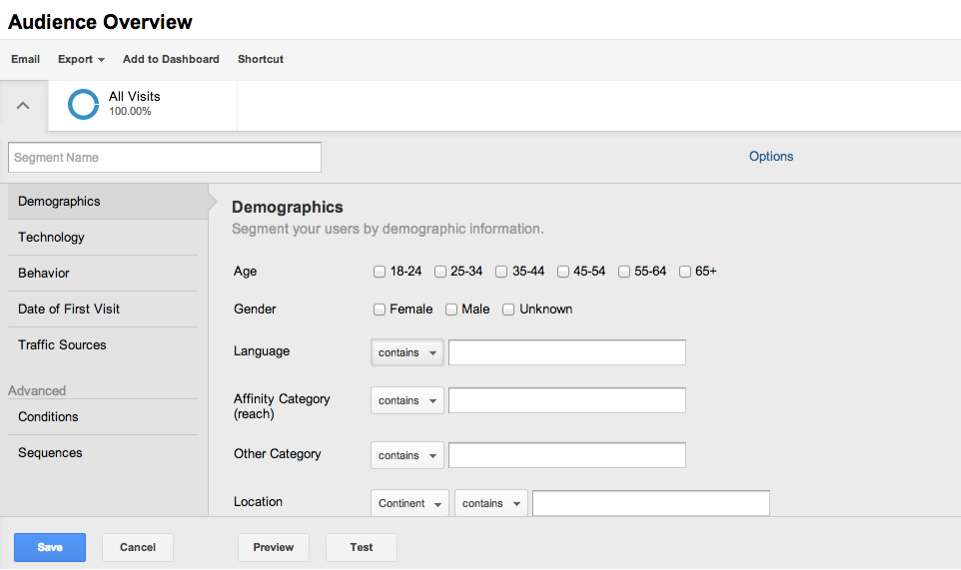
By segmenting your website traffic, you can serve ads that your audience will actually relate to. A great strategy relevant to almost everyone is showing a different ad for someone that has completed a goal vs users that havent. Have a greater overview and more control of your brands message to different types of customers.
It’s important to also remember how many variables there actually are between a user clicking on your ad to then performing the action you want them to take on your website. Improving this process is called conversion rate optimisation (CRO).
Your not optimising 'post-click'
Conversion rate optimisation is the art of understanding and acting on how users move through your site, what actions they take, and what’s stopping them from completing your goals. A good first step to a CRO strategy is done by understanding your users and diving head first into Google Analytics.
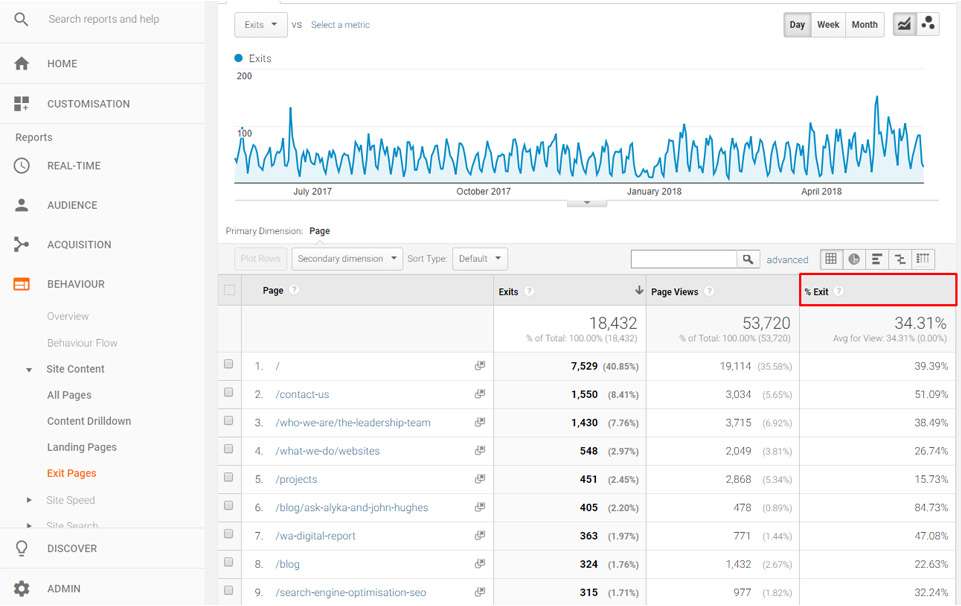
What pages on my website cause users to leave most frequently?
To find out open Google Analytics and head over to Behaviour > Site Content> Exit Pages. You will get a report like this:
Which entry point on my website receives the highest bounce rate? Head over to Behaviour > Landing Pages and check your top landing page performance to find out!
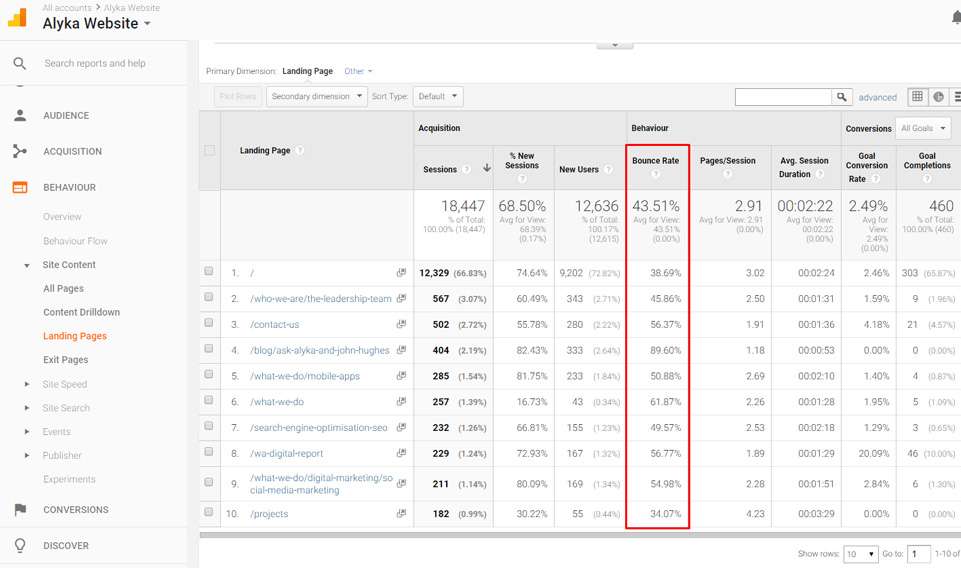
Check high traffic pages with low performance:
Understand which pages have the most potential for improvement by filtering your sessions and conversion rate. Head over to Behaviour > Site Content > Landing Pages then click 'advanced' > select 'sessions greater than 100' and 'goal completions less than 1' (numbers vary based on your websites averages) This will give you a list of pages to get working on.
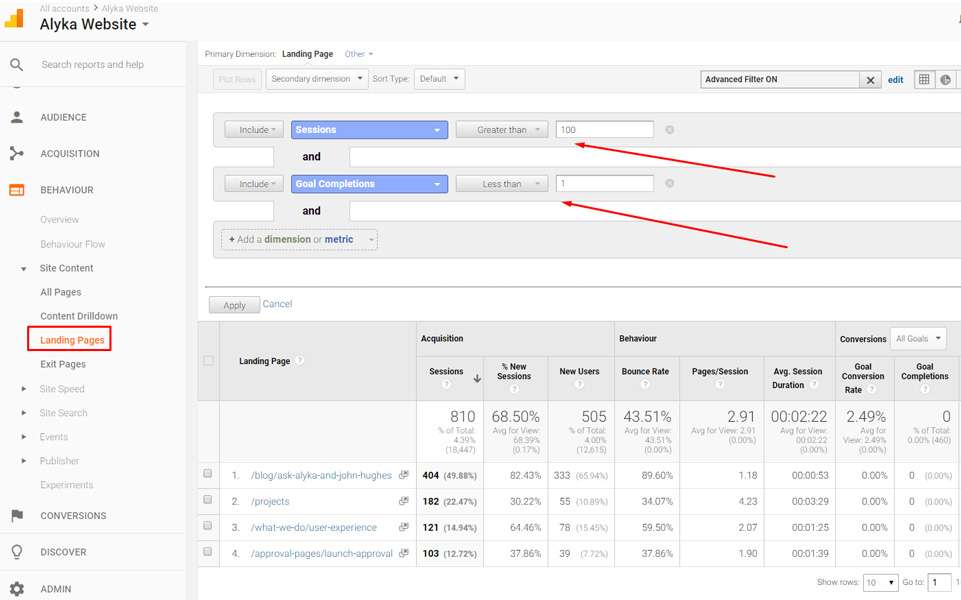
The steps above are an effective way to determine which pages on your website could be causing the most issues and gives you a staring point for optimising.
You don’t know how your campaigns are working together
Find out how your campaigns are working together to drive more conversions.
Clicks cost money and conversions bring you money but how do you give credit to a goal completion that happened without someone clicking on your ad?
Multi channel attribution
Think about the last time you clicked on an ad - did you fill out the form or complete your purchase then and there? 97% of users don't, would you like to find out how all of your marketing efforts are working together to pull it all in line?
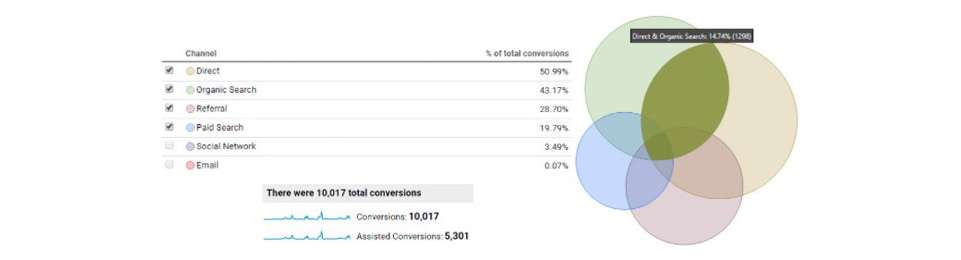
The below report is in Google Ananlytics and allows you to see the percentage of conversion paths that included combinations different traffic sources.
The below report 'Top Conversion Paths' provides a visual of the path your users are taking to get to a conversion. You will be able to see which marketing channels are working and not working together. This information will allow you to see past the 'last click'.
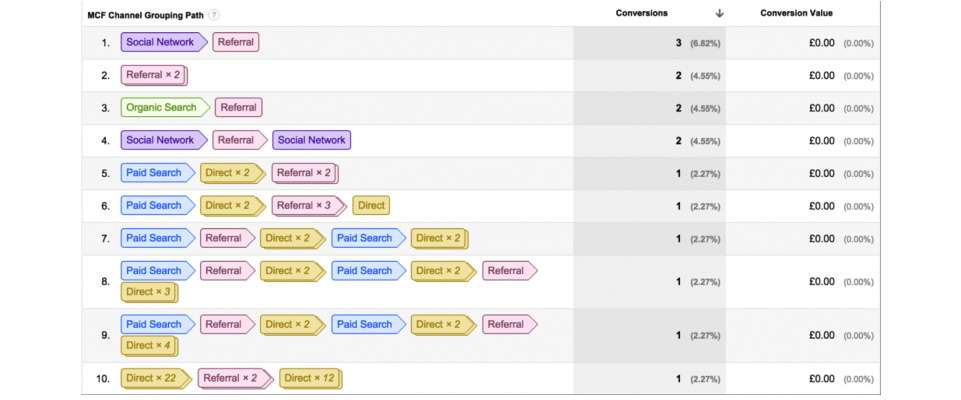
The key to any campaign is to find the right recipe to a users conversion journey and build the campaigns around that. At ALYKA we're not the type to set and forget when it comes to campaigns, we believe that giving credit where credit is due is the best way to understand your audience and nothing does that better than Attribution Modeling.
Attribution Modeling
Before we get into the different type of attribution models, let's paint the scene:
A customer finds your site by clicking on one of your AdWords ads and takes no further action. She returns one week later by clicking through from a social network however on the same day, she comes back a third time via one of your email campaigns, and a few hours later, she returns again directly and makes a purchase (finally).
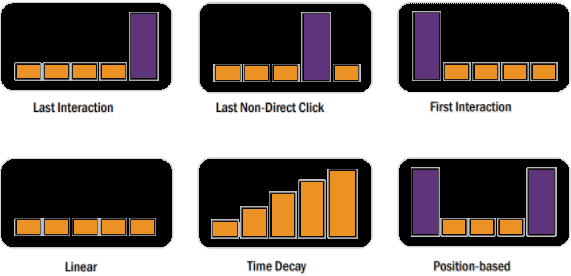
In the Last Interaction attribution model, the last touchpoint (in this case the Direct channel) would receive 100% of the credit for the sale.
In the Last Non-Direct Click attribution model, all direct traffic is ignored, and 100% of the credit for the sale goes to the last channel that the customer clicked through from before converting. For example, an email channel.
In the First Interaction attribution model, the first touchpoint (in this case, the Paid Search channel) would receive 100% of the credit for the sale.
In the Linear attribution model, each touchpoint in the conversion path (in this case the Paid Search, Social Network, Email, and Direct channels) would share equal credit of 25% each for the sale.
In the Time Decay attribution model, the touchpoints closest in time to the sale or conversion get most of the credit. Going back to the scene we painted earlier, since this client purchased your product because they interacted with Direct and Email channels within a few hours of the conversion. These channels will get most of the credit and the Social Network channels will receive less credit.
In the Position Based attribution model, 40% credit is assigned to each the first and last interaction, and the remaining 20% credit is distributed evenly to the middle interactions. In the above example, the Paid Search and Direct channels would each receive 40% credit, while the Social Network and Email channels would each receive 10% credit.
Okay but...in English?
Attribution modeling, conversion rate optimisation, landing page design and audience segmentation can all seem very complicated and overwhelming. It takes a certain type of marketer to analyse it, understand it and then strategise from it but luckily, it doesnt have to be your job.
Get in touch to talk to our team of experts about how to get the most out of your campaigns. We bet there's data hiding in there to grab some quick wins that can bring you more leads, more sales and better results.